Back to the Heart of the Forex Market
Everything starts with you choosing the right location for a trade to happen, this must be done using the evidence that is available to you and brings us back to the heart of the Forex market. Call it support & resistance or call it supply & demand, it really is just the same thing. If you have read the Forex basics article on support & resistance then you will know how we use both terminologies here at ElectroFX for a definitive purpose. If you haven’t been through the basics section before starting here then you need to go do that first.
Since the Forex market moves according to the laws of order flow it leaves behind areas of support & resistance and supply & demand. This gives you information as to where recent order flow existed and, based on the size of the move, how much of it. This is usable information for you to understand where are the most probable locations for the next trade to happen. It may just be 1 piece of the puzzle that you are about to learn here but combined with the other pieces that follow you will be able to achieve a very high win rate if you execute properly.
Location, Location, Location
Trading Forex is an art form that requires you to put as much probability on your side as you can, the first strategy that you need in place is to determine probable location. There is no point trying to guess where new pockets of order flow may form when you can just use the recent history to find them. You can find these areas by looking directly below and to the left of current price, and by looking directly above and to the left of current price. There is a tool included with free membership here at ElectroFX.com that will do this for you but it can also be done manually. With VIP membership here at ElectroFX.com we have a slightly more advanced version that also takes into account the mirror flip areas that have not yet been compromised. For the purpose of this entire Forex trading strategies section the vip membership software will be used along with the daily chart.

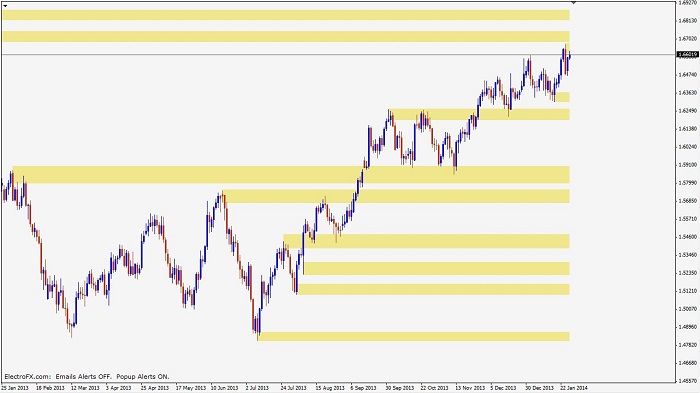
In this image you can see all the viable locations mapped out for you by the software, this includes support & resistance, supply & demand, and the mirror flips of each. These are areas where order flow existed and may exist again on the next visit. Price will very rarely react anywhere other than at one of these boxes. You can probably start to see many trades that you could have taken from one of the boxes that was created, then returned to for another reaction. This is a theme that you need to follow; an area is created, returned to, then reacts again and you simply join in.
Now that you have narrowed trade location down to this collection of boxes, your next job is to decide which box is the most probable to react again when revisited. This is done by understanding how price arrives there on the retest. This is done by making use of the chart patterns that were explained in the Forex trading basics section
The 1st Piece of the Puzzle
Although support & resistance and supply & demand areas could be traded all by themselves, it is not something that we do here at ElectroFX.com. Instead we just use this as 1 piece to our puzzle and by combining a few other simple concepts we are able to get much more specific and much more probable. So specific, in fact, that we are able to answer every question posed in the previous lesson with ease. The next lesson will show you how you can assess which areas are likely to react again, and the most probable type of reaction they will have.
