Chart Patterns and Market Structure
Chart patterns were introduced to you in the Forex trading basics section, they will now help you understand ‘how’ price arrives at these areas of support & resistance and supply & demand from the previous lesson. They will also help you understand what type of trade to expect and therefore also help you judge a probable take profit point. In this lesson we are now going to just use the current market history to explore just that.
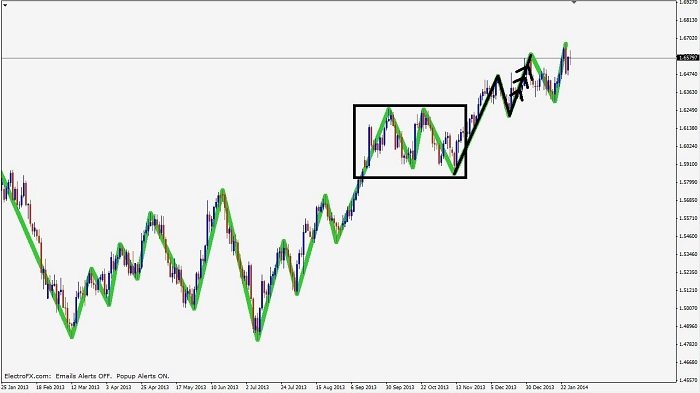
To start things off here is an image of the GBP/USD at the time this lesson is being written. A swing indicator has been placed on the chart to help visually map out the chart patterns and the market structure. Consider this tool like training wheels on a bike, they can be helpful for learning but not so necessary later on.

You should be able to see the chart patterns in that structure and therefore the types of trade that were available. We will now take a look at a few different types of trade that happened at great locations within this current market history.
Trend Continuation for Buying
Starting at the bottom of our GBP/USD chart there is a nice simple trend following pattern, you can see the wave that you would want to be trading from the arrows in this next image. Your knowledge of chart patterns from the Forex basics section of this website should mean that you remember what type of trade this is.

The final wave of this pattern is of course the one that you would want to be part of. The location of that final turn should make complete sense to you at this point but we will take a look at that in the next lesson. For now let’s just focus on the chart patterns of the last 3 different types of trade that were available in this recent history.
Double Top for Selling
The next and very different trade that we have on our chart is a double top pattern for selling. Once again you can see the wave that you would want to be trading from the arrows in this next image. You should recognize this pattern.

The final wave of this pattern is your trade and the location of that final turn is inherent within the pattern itself. We will take a look at it again though in the next lesson as we bring all the pieces of the puzzle together.
3-point Turn for Buying
The next available but different trade in recent history is technically a 3-point turn after a directional reset. In this next image the reset is defined by the double top and following lower low. The black square shows you where this has happened. After that reset in the directional move upwards price raced up and broke the 2 highs that were the double top, then formed the 3 point turn to push higher. This is very similar to the way you would view a range breakout style trade.

As always it is that last wave of the pattern that is your trade. The location element should be obvious to you by now but we will revisit all 3 of the above trades in the next lesson.
